


Double double, toil and trouble; fire burn and cauldron bubble. On All Hallows’ Eve this year, ghouls, goblins, witches, and superheroes were summoned from near and far for a spooktacular event.
Using the virtual powers of Zoom, our fabulous ghost-esses with the most-esses Liza Bolton and Nnenna Asidianya conjured up a spell so powerful that attendees simply couldn’t resist joining in on the fun. What was the spell, you ask? One that enriches one’s knowledge and (evil) genius on how to make compelling data visualisations with the flexible force of the ggplot2 package in R.
What was the most magical part of all? It was the perfect excuse to snazz up your Halloween wardrobe while participating without having to leave your house...or dark terrifying castle!
The workshop was open to all students in the Department of Statistical Sciences programs and students from other POSts taking statistics classes who wanted to spruce-up their knowledge on the basics of using ggplot.
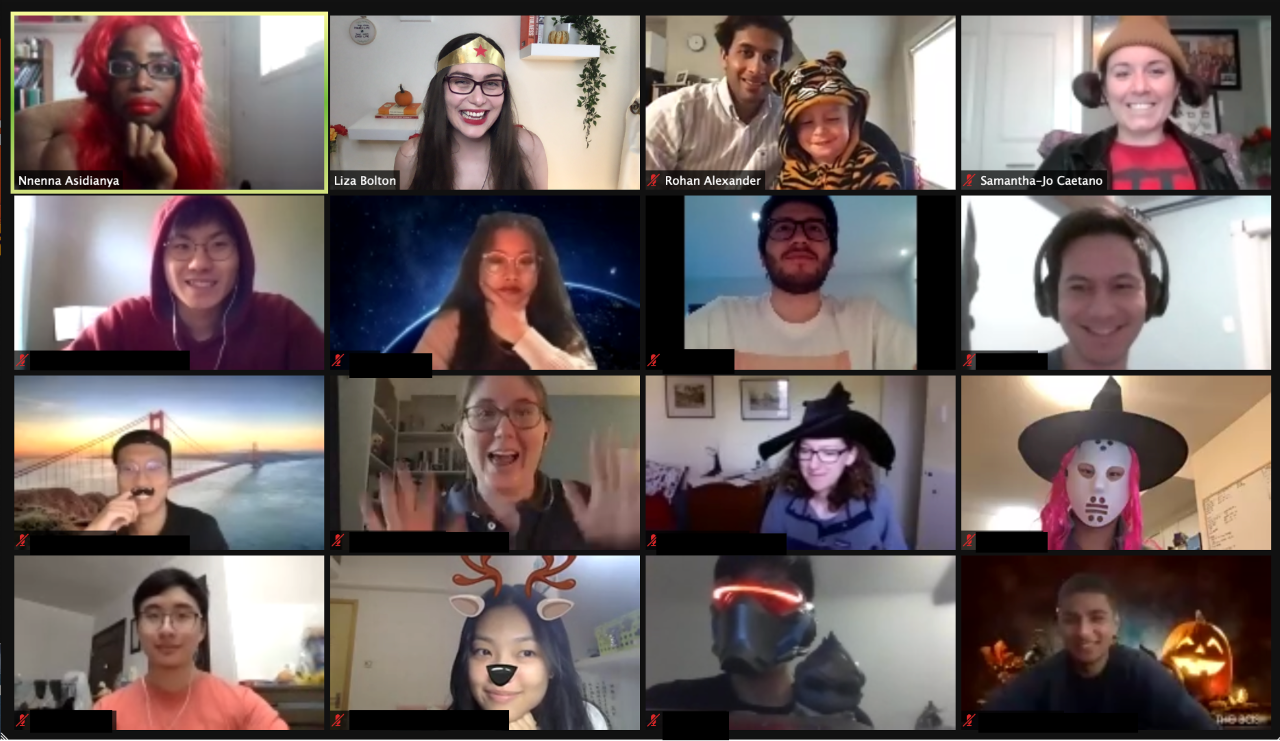
Upon pressing on the Zoom link, participants were welcomed with the classic Michael Jackson hit “Thriller” to get things started. As cameras came on, we were introduced to all kinds of fabooooolous costumes. Witches, pirates, cats, Jason, the classic university student and even Wonder Woman herself joined us! A truly spooky mix if I may say so myself.
After crafting teams in our individual breakout rooms, we joined forces in groups of four to answer some truly spooky halloween questions.
“I liked the social component at the beginning! It was nice being forced to talk to some people and have some fun for a little bit.” - Event participant
Together, we talked about the origins of Halloween, discussed the inspiration for Bram Stoker’s Dracula, and learnt that Jack-O- Lanterns were originally made out of turnips! Who would have thought that pumpkins weren’t the original go-to Jack-O-Lantern canvas?
Following the breakout room social chats and Halloween-themed warmup questions, it was time for the main mysterious event; the conjuring of ggplot2!
Nnenna Asidianya led a fantastic tutorial and tour of ggplot2; a flexible R package used for producing clean and elegant graphics. Based on the Grammar of Graphics, ggplot2 is a graphical concept which allows students to describe plots by using a specific “grammar”. While Nnenna went through the workshop material, Liza would turn to the chat so that students’ questions could be answered instantaneously.
“The idea for a ggplot workshop actually came from one of the students in the Independent Summer Statistics Program, so thanks, Justin!” - Liza Bolton.
While ggplot may not stand for “grim and ghastly” plot (even though it would be pretty cool if it did), this doesn’t mean that we couldn’t add some fun ghostlyness to it in the spirit of Halloween.
This was a terrific opportunity for participants to review the basics of ggplot...with a scary Halloween twist!
“I really liked the quiz part because it was a Halloween theme and kind of interesting! More importantly, I really appreciate Prof. Bolton's and Nnenna's passion plus interaction with everyone, it definitely made it more enjoyable and also helped in a big way!” - Event Participant
“It was wonderful to work on this event with a fellow stats AND Halloween fan like Nenna” writes Liza Bolton, “I’m so glad our students took some time to unwind and have fun. Learning online in a pandemic hasn’t been easy and they have been working so hard.”
While we may have familiarized ourselves with using the R package for academic-based statistical analysis and visualizations, who says it can’t also be used to unleash our creative side? This event did exactly that!
“I appreciated the students’ enthusiasm to participate in the themed event (via costume and liveliness) as it brought out great excitement for me,” writes Nnenna Asidianya, “Actually, it was rewarding to see some of the interactive tools that Liza created for the session resonate with the students. I learned a lot about creating a collaborative environment where students are inspired to learn.”
Are horror movies really released more in October? Which is the spookiest month of all? What did horror movie ratings look like for the last few years? What was the scariest horror movie ever made and how much money did it make? These are just some of the spine-chilling questions that students learnt how to transform into spooktabulous data visualizations.
Among the Booootiful costumes and terrifyingly fun learning experience, the event was the perfect way to start off this year’s Halloween’s festivities while staying social, stat-sy, and safe.